


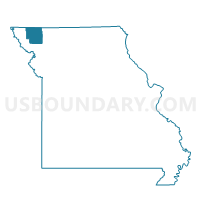
Census Tract 4701, Nodaway County, Missouri
About
Outline

Summary
| Unique Area Identifier | 470245 |
| Name | Census Tract 4701 |
| County | Nodaway County |
| State | Missouri |
| Area (square miles) | 217.58 |
| Land Area (square miles) | 217.39 |
| Water Area (square miles) | 0.19 |
| % of Land Area | 99.91 |
| % of Water Area | 0.09 |
| Latitude of the Internal Point | 40.51586280 |
| Longtitude of the Internal Point | -94.91364540 |
| Total Population | 2,457 |
| Total Housing Units | 1,285 |
| Total Households | 1,060 |
| Median Age | 41.5 |
Maps


Graphs
Select a template below for downloading or customizing gragh for Census Tract 4701, Nodaway County, Missouri


Neighbors
Neighoring Census Tract (by Name) Neighboring Census Tract on the Map
- Census Tract 1802, Taylor County, IA
- Census Tract 1803, Taylor County, IA
- Census Tract 4702, Nodaway County, MO
- Census Tract 4705, Nodaway County, MO
- Census Tract 4906, Page County, IA
- Census Tract 9501, Atchison County, MO
- Census Tract 9601, Worth County, MO
Top 10 Neighboring County Subdivision (by Population) Neighboring County Subdivision on the Map
- Jackson township, Nodaway County, MO (986)
- Nodaway township, Nodaway County, MO (843)
- Hopkins township, Nodaway County, MO (739)
- Union township, Nodaway County, MO (476)
- Union township, Worth County, MO (460)
- Amity township, Page County, IA (430)
- Independence township, Nodaway County, MO (403)
- Atchison township, Nodaway County, MO (400)
- Lincoln township, Nodaway County, MO (389)
- Lincoln township, Atchison County, MO (378)
Top 10 Neighboring Place (by Population) Neighboring Place on the Map
- Burlington Junction city, MO (537)
- Hopkins city, MO (532)
- Parnell city, MO (191)
- Clearmont city, MO (170)
- Elmo city, MO (168)
- Braddyville city, IA (159)
- Blanchard CDP, MO (22)
Top 10 Neighboring Unified School District (by Population) Neighboring Unified School District on the Map
- Bedford Community School District, IA (2,894)
- Tarkio R-I School District, MO (2,264)
- Worth County R-III School District, MO (2,216)
- West Nodaway County R-I School District, MO (1,788)
- South Page Community School District, IA (1,448)
- North Nodaway County R-VI School District, MO (1,376)
- Northeast Nodaway County R-V School District, MO (1,328)
- New Market Community School District, IA (957)
Top 10 Neighboring State Legislative District Lower Chamber (by Population) Neighboring State Legislative District Lower Chamber on the Map
- State House District 4, MO (35,512)
- State House District 97, IA (27,696)
- State House District 96, IA (26,979)
Top 10 Neighboring State Legislative District Upper Chamber (by Population) Neighboring State Legislative District Upper Chamber on the Map
- State Senate District 12, MO (169,332)
- State Senate District 49, IA (60,560)
- State Senate District 48, IA (56,494)
Top 10 Neighboring 111th Congressional District (by Population) Neighboring 111th Congressional District on the Map
Top 10 Neighboring 5-Digit ZIP Code Tabulation Area (by Population) Neighboring 5-Digit ZIP Code Tabulation Area on the Map
- 50833, IA (2,305)
- 64491, MO (1,875)
- 64428, MO (898)
- 64461, MO (897)
- 64475, MO (468)
- 50836, IA (457)
- 64486, MO (455)
- 64431, MO (382)
- 64476, MO (379)
- 64498, MO (375)
Data
Demographic, Population, Households, and Housing Units
** Data sources from census 2010 **
Show Data on Map
Download Full List as CSV
Download Quick Sheet as CSV
| Subject | This Area | Nodaway County | Missouri | National |
|---|---|---|---|---|
| POPULATION | ||||
| Total Population Map | 2,457 | 23,370 | 5,988,927 | 308,745,538 |
| POPULATION, HISPANIC OR LATINO ORIGIN | ||||
| Not Hispanic or Latino Map | 2,446 | 23,068 | 5,776,457 | 258,267,944 |
| Hispanic or Latino Map | 11 | 302 | 212,470 | 50,477,594 |
| POPULATION, RACE | ||||
| White alone Map | 2,424 | 22,083 | 4,958,770 | 223,553,265 |
| Black or African American alone Map | 9 | 566 | 693,391 | 38,929,319 |
| American Indian and Alaska Native alone Map | 4 | 45 | 27,376 | 2,932,248 |
| Asian alone Map | 3 | 378 | 98,083 | 14,674,252 |
| Native Hawaiian and Other Pacific Islander alone Map | 0 | 3 | 6,261 | 540,013 |
| Some Other Race alone Map | 1 | 78 | 80,457 | 19,107,368 |
| Two or More Races Map | 16 | 217 | 124,589 | 9,009,073 |
| POPULATION, SEX | ||||
| Male Map | 1,255 | 11,848 | 2,933,477 | 151,781,326 |
| Female Map | 1,202 | 11,522 | 3,055,450 | 156,964,212 |
| POPULATION, AGE (18 YEARS) | ||||
| 18 years and over Map | 1,865 | 19,107 | 4,563,491 | 234,564,071 |
| Under 18 years | 592 | 4,263 | 1,425,436 | 74,181,467 |
| POPULATION, AGE | ||||
| Under 5 years | 183 | 1,216 | 390,237 | 20,201,362 |
| 5 to 9 years | 141 | 1,149 | 390,463 | 20,348,657 |
| 10 to 14 years | 165 | 1,099 | 396,925 | 20,677,194 |
| 15 to 17 years | 103 | 799 | 247,811 | 12,954,254 |
| 18 and 19 years | 68 | 2,045 | 175,975 | 9,086,089 |
| 20 years | 36 | 1,263 | 86,528 | 4,519,129 |
| 21 years | 23 | 1,275 | 83,511 | 4,354,294 |
| 22 to 24 years | 57 | 1,825 | 243,250 | 12,712,576 |
| 25 to 29 years | 148 | 1,417 | 403,239 | 21,101,849 |
| 30 to 34 years | 140 | 1,163 | 372,228 | 19,962,099 |
| 35 to 39 years | 130 | 1,052 | 368,070 | 20,179,642 |
| 40 to 44 years | 134 | 1,096 | 380,546 | 20,890,964 |
| 45 to 49 years | 187 | 1,322 | 444,766 | 22,708,591 |
| 50 to 54 years | 191 | 1,339 | 443,806 | 22,298,125 |
| 55 to 59 years | 177 | 1,248 | 389,985 | 19,664,805 |
| 60 and 61 years | 54 | 417 | 140,830 | 7,113,727 |
| 62 to 64 years | 82 | 568 | 192,463 | 9,704,197 |
| 65 and 66 years | 58 | 343 | 108,394 | 5,319,902 |
| 67 to 69 years | 65 | 484 | 148,659 | 7,115,361 |
| 70 to 74 years | 112 | 698 | 193,437 | 9,278,166 |
| 75 to 79 years | 75 | 551 | 155,271 | 7,317,795 |
| 80 to 84 years | 75 | 481 | 118,754 | 5,743,327 |
| 85 years and over | 53 | 520 | 113,779 | 5,493,433 |
| MEDIAN AGE BY SEX | ||||
| Both sexes Map | 41.50 | 28.50 | 37.90 | 37.20 |
| Male Map | 40.50 | 28.00 | 36.50 | 35.80 |
| Female Map | 42.30 | 29.20 | 39.20 | 38.50 |
| HOUSEHOLDS | ||||
| Total Households Map | 1,060 | 8,545 | 2,375,611 | 116,716,292 |
| HOUSEHOLDS, HOUSEHOLD TYPE | ||||
| Family households: Map | 706 | 4,847 | 1,552,133 | 77,538,296 |
| Husband-wife family Map | 563 | 3,954 | 1,150,929 | 56,510,377 |
| Other family: Map | 143 | 893 | 401,204 | 21,027,919 |
| Male householder, no wife present Map | 59 | 304 | 109,000 | 5,777,570 |
| Female householder, no husband present Map | 84 | 589 | 292,204 | 15,250,349 |
| Nonfamily households: Map | 354 | 3,698 | 823,478 | 39,177,996 |
| Householder living alone Map | 312 | 2,582 | 672,276 | 31,204,909 |
| Householder not living alone Map | 42 | 1,116 | 151,202 | 7,973,087 |
| HOUSEHOLDS, HISPANIC OR LATINO ORIGIN OF HOUSEHOLDER | ||||
| Not Hispanic or Latino householder: Map | 1,057 | 8,480 | 2,319,445 | 103,254,926 |
| Hispanic or Latino householder: Map | 3 | 65 | 56,166 | 13,461,366 |
| HOUSEHOLDS, RACE OF HOUSEHOLDER | ||||
| Householder who is White alone | 1,050 | 8,269 | 2,020,416 | 89,754,352 |
| Householder who is Black or African American alone | 1 | 83 | 259,539 | 14,129,983 |
| Householder who is American Indian and Alaska Native alone | 1 | 17 | 10,427 | 939,707 |
| Householder who is Asian alone | 0 | 112 | 31,808 | 4,632,164 |
| Householder who is Native Hawaiian and Other Pacific Islander alone | 0 | 1 | 1,605 | 143,932 |
| Householder who is Some Other Race alone | 1 | 10 | 20,727 | 4,916,427 |
| Householder who is Two or More Races | 7 | 53 | 31,089 | 2,199,727 |
| HOUSEHOLDS, HOUSEHOLD TYPE BY HOUSEHOLD SIZE | ||||
| Family households: Map | 706 | 4,847 | 1,552,133 | 77,538,296 |
| 2-person household Map | 373 | 2,404 | 699,051 | 31,882,616 |
| 3-person household Map | 135 | 1,018 | 352,533 | 17,765,829 |
| 4-person household Map | 123 | 895 | 289,496 | 15,214,075 |
| 5-person household Map | 51 | 356 | 133,129 | 7,411,997 |
| 6-person household Map | 18 | 123 | 49,302 | 3,026,278 |
| 7-or-more-person household Map | 6 | 51 | 28,622 | 2,237,501 |
| Nonfamily households: Map | 354 | 3,698 | 823,478 | 39,177,996 |
| 1-person household Map | 312 | 2,582 | 672,276 | 31,204,909 |
| 2-person household Map | 37 | 763 | 123,465 | 6,360,012 |
| 3-person household Map | 4 | 206 | 17,929 | 992,156 |
| 4-person household Map | 0 | 98 | 7,052 | 411,171 |
| 5-person household Map | 1 | 38 | 1,848 | 126,634 |
| 6-person household Map | 0 | 8 | 559 | 48,421 |
| 7-or-more-person household Map | 0 | 3 | 349 | 34,693 |
| HOUSING UNITS | ||||
| Total Housing Units Map | 1,285 | 9,524 | 2,712,729 | 131,704,730 |
| HOUSING UNITS, OCCUPANCY STATUS | ||||
| Occupied Map | 1,060 | 8,545 | 2,375,611 | 116,716,292 |
| Vacant Map | 225 | 979 | 337,118 | 14,988,438 |
| HOUSING UNITS, OCCUPIED, TENURE | ||||
| Owned with a mortgage or a loan Map | 387 | 2,907 | 1,118,792 | 52,979,430 |
| Owned free and clear Map | 394 | 2,325 | 514,818 | 23,006,644 |
| Renter occupied Map | 279 | 3,313 | 742,001 | 40,730,218 |
| HOUSING UNITS, VACANT, VACANCY STATUS | ||||
| For rent Map | 23 | 250 | 92,946 | 4,137,567 |
| Rented, not occupied Map | 0 | 7 | 4,290 | 206,825 |
| For sale only Map | 13 | 96 | 44,200 | 1,896,796 |
| Sold, not occupied Map | 8 | 26 | 11,098 | 421,032 |
| For seasonal, recreational, or occasional use Map | 9 | 61 | 80,374 | 4,649,298 |
| For migrant workers Map | 0 | 0 | 193 | 24,161 |
| Other vacant Map | 172 | 539 | 104,017 | 3,652,759 |
| HOUSING UNITS, OCCUPIED, AVERAGE HOUSEHOLD SIZE BY TENURE | ||||
| Total: Map | 2.32 | 2.31 | 2.45 | 2.58 |
| Owner occupied Map | 2.37 | 2.47 | 2.54 | 2.65 |
| Renter occupied Map | 2.17 | 2.06 | 2.25 | 2.44 |
| HOUSING UNITS, OCCUPIED, TENURE BY RACE OF HOUSEHOLDER | ||||
| Owner occupied: Map | 781 | 5,232 | 1,633,610 | 75,986,074 |
| Householder who is White alone Map | 774 | 5,164 | 1,474,738 | 63,446,275 |
| Householder who is Black or African American alone Map | 0 | 8 | 110,128 | 6,261,464 |
| Householder who is American Indian and Alaska Native alone Map | 1 | 9 | 6,019 | 509,588 |
| Householder who is Asian alone Map | 0 | 25 | 17,427 | 2,688,861 |
| Householder who is Native Hawaiian and Other Pacific Islander alone Map | 0 | 0 | 600 | 61,911 |
| Householder who is Some Other Race alone Map | 0 | 3 | 8,794 | 1,975,817 |
| Householder who is Two or More Races Map | 6 | 23 | 15,904 | 1,042,158 |
| Renter occupied: Map | 279 | 3,313 | 742,001 | 40,730,218 |
| Householder who is White alone Map | 276 | 3,105 | 545,678 | 26,308,077 |
| Householder who is Black or African American alone Map | 1 | 75 | 149,411 | 7,868,519 |
| Householder who is American Indian and Alaska Native alone Map | 0 | 8 | 4,408 | 430,119 |
| Householder who is Asian alone Map | 0 | 87 | 14,381 | 1,943,303 |
| Householder who is Native Hawaiian and Other Pacific Islander alone Map | 0 | 1 | 1,005 | 82,021 |
| Householder who is Some Other Race alone Map | 1 | 7 | 11,933 | 2,940,610 |
| Householder who is Two or More Races Map | 1 | 30 | 15,185 | 1,157,569 |
| HOUSING UNITS, OCCUPIED, TENURE BY HISPANIC OR LATINO ORIGIN OF HOUSEHOLDER | ||||
| Owner occupied: Map | 781 | 5,232 | 1,633,610 | 75,986,074 |
| Not Hispanic or Latino householder Map | 780 | 5,209 | 1,605,838 | 69,617,625 |
| Hispanic or Latino householder Map | 1 | 23 | 27,772 | 6,368,449 |
| Renter occupied: Map | 279 | 3,313 | 742,001 | 40,730,218 |
| Not Hispanic or Latino householder Map | 277 | 3,271 | 713,607 | 33,637,301 |
| Hispanic or Latino householder Map | 2 | 42 | 28,394 | 7,092,917 |
| HOUSING UNITS, OCCUPIED, TENURE BY HOUSEHOLD SIZE | ||||
| Owner occupied: Map | 781 | 5,232 | 1,633,610 | 75,986,074 |
| 1-person household Map | 196 | 1,214 | 369,640 | 16,453,569 |
| 2-person household Map | 330 | 2,114 | 629,004 | 27,618,605 |
| 3-person household Map | 106 | 765 | 262,364 | 12,517,563 |
| 4-person household Map | 95 | 729 | 221,292 | 10,998,793 |
| 5-person household Map | 36 | 273 | 97,390 | 5,057,765 |
| 6-person household Map | 13 | 94 | 34,420 | 1,965,796 |
| 7-or-more-person household Map | 5 | 43 | 19,500 | 1,373,983 |
| Renter occupied: Map | 279 | 3,313 | 742,001 | 40,730,218 |
| 1-person household Map | 116 | 1,368 | 302,636 | 14,751,340 |
| 2-person household Map | 80 | 1,053 | 193,512 | 10,624,023 |
| 3-person household Map | 33 | 459 | 108,098 | 6,240,422 |
| 4-person household Map | 28 | 264 | 75,256 | 4,626,453 |
| 5-person household Map | 16 | 121 | 37,587 | 2,480,866 |
| 6-person household Map | 5 | 37 | 15,441 | 1,108,903 |
| 7-or-more-person household Map | 1 | 11 | 9,471 | 898,211 |
Loading...